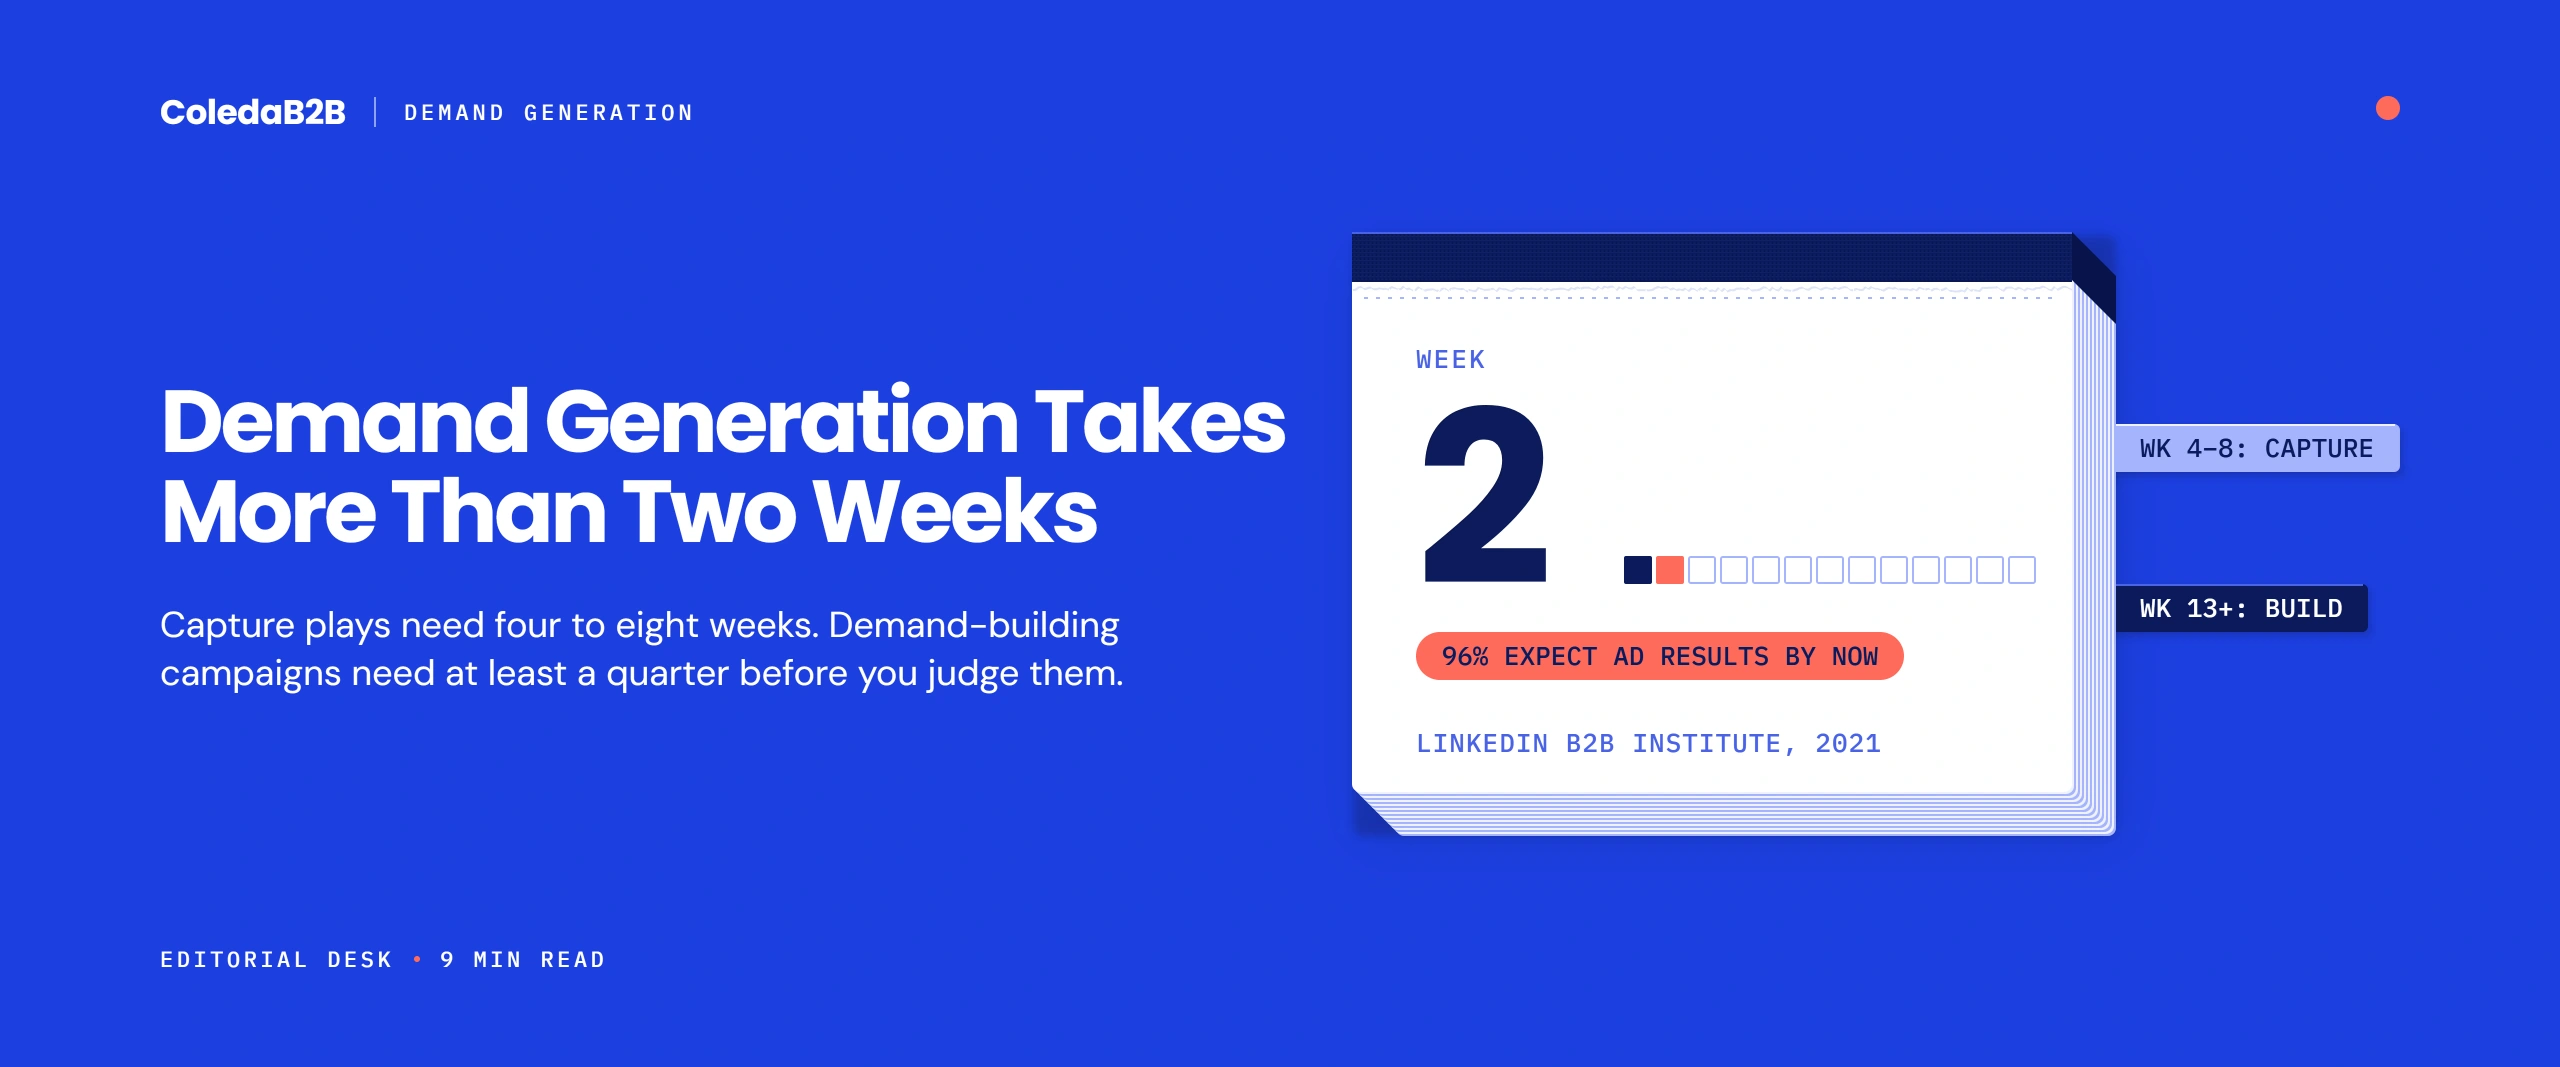
A lead conversion rate is the share of leads that move from one funnel stage to the next. Published B2B ranges are roughly 25% to 35% from lead to MQL, 13% to 26% from MQL to SQL, 50% to 62% from SQL to opportunity and 15% to 30% from opportunity to closed deal. Treat these as rough guides, because stage definitions differ widely between companies.
Definition: A lead conversion rate is the percentage of leads at one stage of the funnel, such as MQL, that reach the next stage, such as SQL, within a defined period.
What Is a Lead Conversion Rate?
“Lead conversion rate” can mean several things, so be precise. In B2B, it usually refers to one of these stage-to-stage rates:
- Lead to MQL: the share of new leads that meet your marketing qualification criteria
- MQL to SQL: the share of MQLs that sales confirms as worth pursuing
- SQL to opportunity: the share of SQLs that become a tracked deal with a value and expected close date
- Opportunity to close: the share of opportunities you win, also called the win rate
- Lead to customer: the share of all leads that eventually buy
Importantly, each rate tells you something different. For example, a low MQL to SQL rate points to targeting or qualification problems, while a low win rate points to sales or competitive problems. For the definitions behind the two middle stages, see MQL vs SQL.
How to Calculate Each Stage
Use the same time window and the same group of leads for every rate. Otherwise, the numbers will not connect.
| Rate | Formula |
| Lead to MQL | MQLs ÷ new leads in the period × 100 |
| MQL to SQL | SQLs ÷ MQLs from the same group × 100 |
| SQL to opportunity | Opportunities ÷ SQLs from the same group × 100 |
| Opportunity to close (win rate) | Deals won ÷ (deals won + deals lost) × 100 |
| Lead to customer | New customers ÷ new leads from the same group × 100 |
Two details matter here. First, track cohorts, meaning a group of leads created in the same month, and follow them through each stage. Second, allow enough time. In long B2B cycles, many leads reach later stages months after they arrive.
Lead Conversion Rate Benchmarks by Stage
Next, the table below brings together published ranges, with the source for each one. These are broad reference points, not targets.
| Stage | Published range | Source and year | Note |
| Lead to MQL | 25% to 35% | Hi Bob, summary of First Page Sage and Gartner figures, 2025 | Described by the source as rough benchmarks |
| MQL to SQL | 13% to 26% | HiBob summary, 2025; First Page Sage industry data, updated 2025 | Varies strongly by industry (see below) |
| SQL to opportunity | 50% to 62% | Hi Bob, summary, 2025 | Depends on how strictly you define an SQL |
| Opportunity to close | 15% to 30% | Hi Bob, summary, 2025 | Moves with market conditions and deal size |
HiBob’s 2025 summary of funnel benchmarks draws these ranges from First Page Sage and Gartner research. However, it does not tie each range to a single study. So use them only to check whether your own numbers are in a reasonable zone.
Win rates also move with the wider market. Ebsta and Pavilion’s 2024 B2B Sales Benchmarks, based on 4.2 million opportunities across 530 companies, found that win rates in 2023 were 18% lower than in 2022 and 27% lower than in 2021, in relative terms. A rate that was normal two years ago may not be normal today.
MQL to SQL Conversion Rate by Industry
The MQL to SQL rate is the most watched lead conversion rate, because it shows how well marketing and sales agree on lead quality. First Page Sage’s separate funnel report shows much higher MQL to SQL rates for B2B SaaS because it uses different stage definitions and client samples, which is a good example of why benchmarks only work with matching definitions.
| Industry | MQL to SQL conversion rate |
| Industrial IoT | 18% |
| Manufacturing | 16% |
| Cybersecurity | 15% |
| Software development | 14% |
| B2B SaaS | 13% |
| IT and managed services | 13% |
| Financial services | 13% |
| Healthcare | 13% |
| Staffing and recruiting | 12% |
| Fintech | 11% |
Overall, most B2B technology sectors sit between 11% and 18% in this dataset. However, this is one firm’s client base, so treat the figures as a reference point rather than an industry standard.
Why Rates Differ by Channel and Deal Size
In practice, two companies with the same rate may be doing very different things. Several factors explain the gap:
- Definitions. A strict MQL definition lowers lead to MQL rates but raises MQL to SQL rates. A loose one does the opposite.
- Channel. Leads from referrals and high-intent searches usually convert better than leads from broad content offers, because the buyer is further along.
- Deal size. Large deals involve more people and longer cycles, so fewer leads convert within any given quarter.
- Speed of follow-up. Research published in Harvard Business Review in 2011 found that firms contacting a lead within an hour were nearly seven times as likely to qualify it as those that waited longer.
- Data quality. Wrong titles or bounced emails turn real interest into dead leads.
For these reasons, compare your lead conversion rate mainly against your own history, split by channel and segment.
Lead Conversion Rate by Source: What to Expect
Different sources produce leads at different stages of readiness. So expect different rates, and judge each source on its own trend.
- Demo and pricing requests are the most ready. They should convert to SQL at a high rate, and any drop usually points to slow follow-up.
- Referrals arrive with trust already built, so they often convert well at every stage.
- Webinar attendees show real interest in a topic. Many need a few weeks of nurture before sales.
- Content downloads and syndicated leads show early interest. Expect lower MQL to SQL rates at first, then higher rates when nurture and account signals are added.
- Outbound contacts depend heavily on targeting and message. Their rates vary most between teams.
Report each source separately on your dashboard. Otherwise, a strong source can hide a weak one, and you may cut the program that is actually feeding next quarter’s pipeline.
What Moves Each Lead Conversion Rate
| Rate | Main levers |
| Lead to MQL | Better targeting, stronger offers, data enrichment, a clear scoring model |
| MQL to SQL | Agreed criteria with sales, faster follow-up, context sent with each lead, account-level signals |
| SQL to opportunity | Better discovery calls, clear opportunity rules, the right person in the meeting |
| Opportunity to close | Fit with the right segments, proof for the buying group, competitive positioning |
Account context also helps at almost every stage. When several people from one company engage, the lead usually converts more often. To capture that signal, score engagement at the account level as well as per contact.
At the MQL to SQL stage, meanwhile, clear criteria make the biggest difference. Our guide to how to qualify leads before sales outreach sets out the criteria and acceptance rule that improve this rate.
A Worked Example: Finding the Stage That Matters Most
Here is an illustrative example of one monthly cohort of 1,000 leads, using rates inside the published ranges.
| Stage | Rate | Leads remaining |
| New leads | 1,000 | |
| Lead to MQL | 30% | 300 MQLs |
| MQL to SQL | 15% | 45 SQLs |
| SQL to opportunity | 56% | about 25 opportunities |
| Opportunity to close | 20% | about 5 deals |
Now suppose the team improves only one lead conversion rate: MQL to SQL rises from 15% to 20%, through clearer criteria and faster follow-up. The same 300 MQLs now produce 60 SQLs, about 34 opportunities, and about 6.7 deals instead of 5.0. One five-point gain in the middle of the funnel lifts closed deals by a third, without a single extra lead.
That is why the middle stages often deserve more attention than lead volume. Before buying more leads, check whether better qualification and follow-up would grow the pipeline faster.
Build Your Own Lead Conversion Rate Benchmarks
Published ranges are useful for a first check. Your own data, however, is far more useful for decisions. To build internal benchmarks:
1. Fix your definitions for each stage in the CRM, and keep them stable.
2. Pick cohorts by month of lead creation.
3. Track each cohort for at least two full sales cycles.
4. Split by channel, segment, and deal size.
5. Set targets slightly above your current medians, and review them each quarter.
After two or three quarters, you will know what “good” looks like for your business, which no outside benchmark can tell you.
How to Report Conversion to Leadership
Above all, leaders want to know where the funnel leaks and what you are doing about it. So keep the report simple:
- One funnel view showing each stage rate for the last two quarters
- The biggest change and its likely cause
- Rates by channel, to show where to invest more or less
- Pipeline and revenue that the funnel produced
- One or two actions for the next quarter
Also avoid reporting single-month rates for long cycles. Rolling quarterly cohorts give a fairer picture.
Common Mistakes With Conversion Benchmarks
- Comparing against unsourced round-ups that mix different definitions and years
- Changing stage definitions without resetting your baseline
- Measuring too early, before leads have had time to progress
- Averaging all channels together, which hides the strong and weak ones
- Chasing a higher rate by narrowing volume so much that the total pipeline falls
How ColedaB2B Improves Conversion at the Source
Ultimately, conversion starts with lead quality. As a partner offering B2B lead generation services, we deliver leads built to your stage definitions, with consent and the content context your team needs to follow up. Every lead goes through a three-step check of automated validation and human review before delivery, and our 98.3% rate of acceptance reflects that process. Our team does all work in-house, following GDPR and CCPA.
Want to see how our leads would convert in your funnel? Share your MQL criteria, and we will send a sample of leads built to them.
FAQs:
It depends on the stage. Published ranges are roughly 25% to 35% from lead to MQL and 13% to 26% from MQL to SQL. Because stage definitions differ so much, compare your rates mainly with your own history, split by channel and segment.
Published ranges run from about 13% to 26%. First Page Sage’s industry data puts most B2B technology sectors between 11% and 18%, with B2B SaaS at 13% and cybersecurity at 15%. Agreed criteria with sales and fast follow-up raise this rate most.
Divide the number of leads that reached the next stage by the number that started at the previous stage, then multiply by 100. Use the same group of leads and the same time window for both numbers, and allow time for longer sales cycles.
The most common causes are loose MQL criteria, poor-fit targeting, bad contact data and slow follow-up. Agree MQL criteria with sales, record a reason for every rejected lead and check how quickly sales contacts new MQLs. These steps usually reveal the main cause.
Leads from referrals and high-intent search usually convert best, because buyers are further along when they arrive. Broad content offers bring more volume at lower conversion. Measure rates by channel in your own CRM, because results vary by audience and offer.