
ABM ROI is the return your account-based marketing program earns for every dollar spent. To earn trust from finance, calculate it on gross margin, not revenue; include every cost; keep the sourced and influenced pipeline apart; and compare target accounts with a control group. Then report it on one page.
Definition: ABM ROI is the gross profit from revenue that account-based marketing created, minus the full cost of the program, divided by that cost.
Updated November 2026
Why Finance Is Asking Harder Questions About ABM
Today, marketing budgets are tight. The Gartner 2025 CMO Spend Survey found that budgets held flat at 7.7% of company revenue. It also found that 59% of CMOs said they lacked the budget to carry out their strategy. So every program must earn its place.
Moreover, ABM draws extra attention for two reasons. First, the cost per account is high because it uses research, personal content, and focused media. Second, deals take months to close, so revenue arrives long after the spend.
Practitioners certainly believe in it. In a Momentum ITSMA benchmarking study of 279 ABM heads and practitioners, published in 2023, 72% said ABM delivers higher ROI than other types of marketing. Still, that is what marketers report about themselves. A CFO wants proof from your own numbers, and that is what the rest of this guide gives you.
The Five Questions CFOs Ask About ABM ROI
Finance teams rarely ask about impressions or engagement. Instead, they ask five questions, and each one has a number that answers it.
| What the CFO asks | What they really want to know | The number that answers it |
| “What did we get?” | Revenue and profit created | Closed-won revenue and return on gross margin |
| “Would it have happened anyway?” | Because, not by coincidence | Control group comparison |
| “Is there enough in the pipeline?” | Whether targets are reachable | Pipeline coverage |
| “When will we see the return?” | Timing of cash | Leading indicators by quarter |
| “Where should the next dollar go?” | Which part of the program works best? | Return by tier and by segment |
If your report answers these five questions, the budget conversation becomes much easier.
The ABM ROI Formula, Done Properly
At its core, the formula is simple:
ABM ROI = (Gross profit from ABM revenue − Total ABM cost) ÷ Total ABM cost
Two details make it credible.
Use gross margin, not revenue. If you sell a $100,000 deal at a 75% gross margin, the deal adds $75,000 in gross profit. Finance will always use margin, so do the same before they do it for you.
Include every cost. In practice, most ABM ROI reports leave out people and data, which makes the return look better than it is. Use this checklist:
- Paid media, such as account-targeted ads and sponsored content
- Intent and contact data
- ABM and analytics software, pro-rated to the period
- Content creation, including personalized assets for 1:1 accounts
- Partner or outsourced program fees
- People: the share of salaries for marketing and sales staff who work on ABM
- Events and direct mail, if used
Worked Example: Calculating ABM ROI Step by Step
We made up the figures below to show the method. They describe one year of a mid-size ABM program.
| Step | Item | Amount |
| 1 | Paid media | $120,000 |
| 2 | Intent and contact data | $40,000 |
| 3 | Software (pro-rated) | $60,000 |
| 4 | Content | $50,000 |
| 5 | Partner fees | $80,000 |
| 6 | People (share of salaries) | $100,000 |
| 7 | Total ABM cost | $450,000 |
| 8 | Closed-won revenue from ABM-sourced deals | $1,200,000 |
| 9 | Gross margin | 75% |
| 10 | Gross profit (step 8 × step 9) | $900,000 |
| 11 | Return on investment ((step 10 − step 7) ÷ step 7) | 100% |
In other words, every dollar spent returned two dollars of gross profit: one to cover the cost and one on top. By contrast, if you had used revenue instead of gross profit, the result would have been 167%. That higher number may look better. Even so, finance would reject it.
Sourced, Influenced, and Accelerated: Count Each Once
Most arguments about ABM ROI are really arguments about counting. So agree on three definitions with finance before the first report.
- Sourced: the opportunity did not exist before ABM activity began in the account. ABM created it.
- Influenced: the opportunity already existed, and ABM activity touched people in the account before it closed.
- Accelerated: the opportunity closed faster than similar deals without ABM.
Then follow two rules. First, calculate ROI on sourced revenue only. Second, the report influenced the pipeline as a separate line, never added to sourced. As a result, this avoids double counting and keeps the headline number defensible.
Prove Cause With a Control Group
Attribution shows what happened. In contrast, a control group shows what would have happened without ABM. After all, that is the question finance cares about most.
Here is how to set one up:
- Build a matched list. For every target account, pick a similar account by industry, size, region, and past engagement.
- Hold it back. Run ABM on the target list only. Keep normal marketing running for both lists.
- Fix the period. Compare the two lists over the same 6 to 12 months.
- Compare four numbers: opportunity rate, win rate, average deal size, and sales cycle length.
For example, a made-up result might look like this:
| Metric | ABM accounts | Control group |
| Accounts that opened an opportunity | 24% | 12% |
| Win rate | 28% | 18% |
| Average deal size | $62,000 | $48,000 |
| Average sales cycle | 5.1 months | 6.4 months |
If the ABM list beats the control group on most lines, you have evidence of cause, not just correlation. If it does not, however, you have learned something useful before spending more.
Pipeline Coverage: The Number That Shows Whether Targets Are Reachable
Revenue lags. Pipeline coverage, on the other hand, shows the direction early. Calculate it like this:
Pipeline needed = Bookings target ÷ Your historical win rate is Pipeline coverage = Current pipeline in target accounts ÷ Pipeline needed.
For example, a $4 million booking target with a 25% win rate needs $16 million in pipeline. If target accounts hold $10 million today, coverage is 62.5%. In short, that tells finance exactly how much more pipeline the program must create and by when.
What to Show Each Quarter Before Revenue Arrives
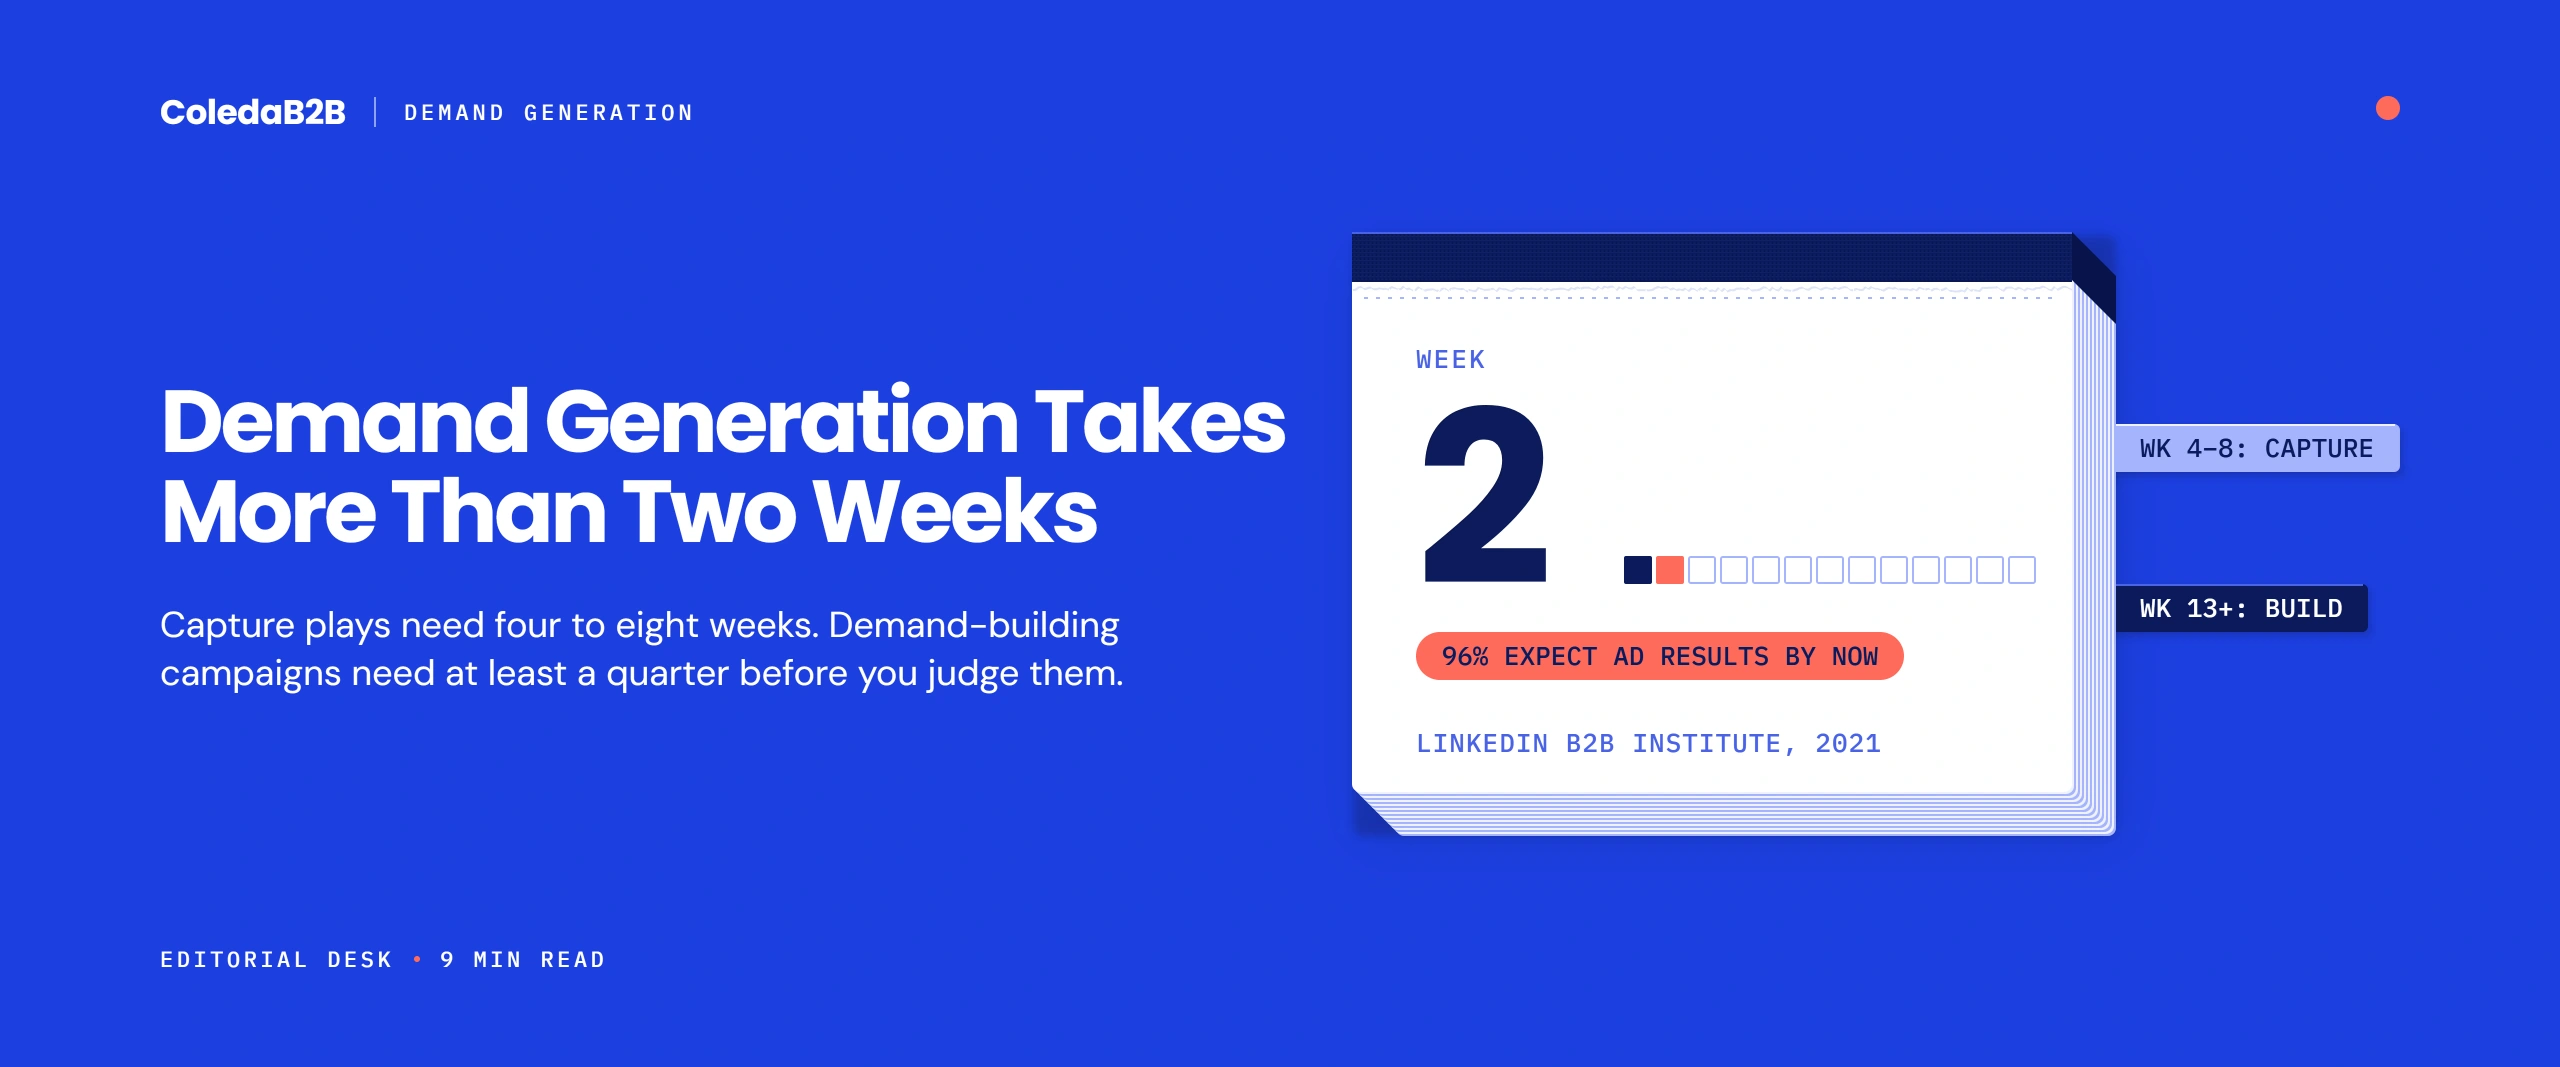
Deals in target accounts often take six months or more. So agree in advance what success looks like at each stage.
| Quarter | What to show | Example measure |
| Q1 | Reach and engagement in target accounts | Share of accounts with engaged buying group members |
| Q2 | Meetings and opportunities | Opportunities opened in target accounts |
| Q3 | Pipeline | Sourced pipeline value and pipeline coverage |
| Q4 | Revenue and return | Closed-won revenue and return on gross margin |
To measure the first two stages properly, score engagement at the account level rather than counting individual leads. Most analytics tools for B2B teams can track these numbers once your CRM records which accounts are in the program.
ABM ROI by Tier
Most ABM programs run three tiers, and each one earns its return differently.
| Tier | Typical scope | Cost per account | What drives the return? |
| 1:1 | A handful of strategic accounts | Highest | Large deal sizes and multi-year contracts |
| 1:few | Small clusters of similar accounts | Medium | Shared content and plays across a cluster |
| 1:many | Hundreds of accounts | Lowest | Scale, intent data, and efficient media |
Report ABM ROI for each tier separately. Otherwise, a strong 1:many program can hide a weak 1:1 program, or the reverse. For more on choosing tiers and accounts, see our ABM strategy guide and our notes on ABM for enterprise accounts.
Count Existing Customers Too
ABM is not only for new logos. In fact, many programs target existing customers for upsell and cross-sell. When they do, count that expansion in the return, using the same counting rules. Also, expansion deals often close faster because trust and contracts already exist. For the full method, see how to grow expansion revenue.
Set Up ABM ROI Tracking Before Launch
Most ROI arguments start because teams added tracking after the program began. So set these up in your CRM before the first campaign goes live:
- ABM flag and tier on every target account, with the date it joined the program.
- Control group flag on every matched account you hold back.
- Opportunity source rule that marks an opportunity as ABM-sourced only if it opened after the account joined the program.
- Stage dates on every opportunity, so you can measure cycle length and acceleration.
- Contact roles for engaged people, so you can show buying group reach.
- Cost tracking by month and by tier, agreed with finance.
With these fields in place, every number in the board report comes straight from the CRM. As a result, finance can check it themselves, which builds trust faster than any slide.
The One-Page ABM ROI Board Report
Finance prefers one page with the same lines every quarter. Use this template.
| Line | This quarter | Last quarter | Note |
| Pipeline coverage | 62% | 48% | Target is 100% by Q4. |
| Sourced pipeline | $3.1M | $2.2M | New opportunities ABM created |
| Influenced pipeline (separate) | $4.5M | $4.0M | Not added to source |
| Closed-won revenue (sourced) | $0.4M | $0.2M | Deals closed this quarter. |
| Return to date (gross margin) | 35% | 10% | Rising as deals close |
| Control group gap | +10 pts win rate | +7 pts | ABM accounts versus matched group |
Note that the numbers above are examples only. Add one sentence under the table on what changed and what you will do next quarter. That is all most finance teams need.
When the Early Numbers Look Weak
Early results often disappoint, because ABM pays back over a full sales cycle. Before anyone cuts the budget, check four things:
- Is it too early? Compare the program’s age with your normal sales cycle. A six-month program in a nine-month cycle has not had time to close deals.
- Is coverage rising? If pipeline coverage grows each quarter, revenue usually follows.
- Is one tier or segment dragging the total? Split results by tier, industry and region, and fix or drop the weak part.
- Is the target list right? If engagement stays low after two quarters, the accounts may not fit. Review the list with sales.
In most cases, the answer is a change in focus, not an end to the program. So share this check with finance openly. Leaders trust a team that spots its own problems early.
What to Leave Out of the Report
Some numbers help the marketing team but confuse finance. Keep these in your working dashboards, not in the board report:
- Impressions, reach and click-through rates
- Lead or MQL counts without pipeline context
- Content downloads on their own
- Website traffic from target accounts, unless it links to opportunities
They are useful for running campaigns. However, they do not answer any of the five CFO questions.
Common Measurement Mistakes
- Using revenue instead of gross margin. Finance will recalculate it, and trust drops.
- Leaving out people costs. Teams most often overstate the return this way.
- Adding influenced to sourced. Double counting makes every number suspect.
- Measuring too early. Judge revenue after a full sales cycle, and judge earlier quarters on leading signs.
- No control group. Without one, you cannot show the program caused the result.
How ColedaB2B Helps Prove the Return on ABM
As a partner, we run account-based marketing programs that we design for measurement from day one. First, we agree the target list, the counting rules and the control group with you before launch. Then we reach buying groups through our seven owned B2B publishers and our 50M+ contact database, with in-house delivery and no subcontracting. As a result, every report ties activity to accounts, pipeline and revenue. If you are comparing partners, use our checklist to score ABM partners before you sign.
Need to show finance what ABM is returning? Share your current program and numbers, and we will review how to measure and report the return the way your CFO expects.
FAQs:
Take the gross profit from revenue that ABM sourced, subtract the full program cost, and divide by that cost. Be sure to include media, data, software, content, partner fees and the people working on the program.
It depends on deal size, margin and sales cycle. In practice, a useful test is whether the return beats your other marketing programs, measured the same way, and whether ABM accounts outperform a matched control group.
Usually one full sales cycle, often six to twelve months in B2B. Before then, show engagement, opportunities and pipeline coverage as leading signs.
Sourced pipeline is new opportunities that ABM created. Influenced pipeline is existing opportunities that ABM touched before they closed. So report them separately and calculate ROI on sourced revenue only.
Pipeline coverage, sourced pipeline, closed-won revenue, return on gross margin and the gap between ABM accounts and a control group. These answer cause, return and timing.